Extensive wind-tunnel measurements were taken for the symmetrical NACA0012 airfoil at the Langley Research Center’s 8-foot transonic pressure tunnel. The tests were conducted at lift coefficients from near-zero through Mach number values from 0.3 to 0.86 for Reynolds numbers of 3.0×10⁶ to 9.0×10⁶ with transition fixed at 5% of chord length. These experimental results serve as a basis for conducting a turbulent simulation using the Spalart-Allmaras model present in the AEROFLO program.
The NACA0012 airfoil at an angle of attack, α, of 2.86º was chosen, since it has long been a standard two-dimensional model for evaluating wind-tunnel test techniques and computational methods. Comparisons of results from AEROFLO’s simulation and the experiments are provided for the condition Ma = 0.86, Re = 9.0×10⁶. Details of the experiment can be found in the NACA Technical Memorandum 81927
Mesh
The computational domain employs a block with 245 x 50 x 3 grid points (Figure 1). The grid is an O-grid with the i direction oriented along the surface of the airfoil.
Figure 1. Mesh of the domain
Simulation Parameters
Table 1. Simulation Parameters
The simulation type is simple CFD using both the WENO (33 and 34) and the MUSCL scheme for spatial differencing and the Beam-Warming scheme for time differencing. The problem is solved as though two-dimensional in i and j directions. (Note that although no spatial differencing is done in the k direction, 3 grid points are still required in this direction as this is the minimum number of grid points allowed in any direction.) The Spalart-Allmaras model is used for the simulation with trip points on the surface of the blade: one each on the pressure and suction side.
Obtain the Files
Both mesh files and project input files can be accessed below. Remember to place the grid files in a subfolder with the set up file /airfoil.
Change the directory to the subfolder with the selected grid and spatial scheme. Start the simulation by
mpirun –np 1 mpiaeroflo.exe < foil.afl
Simulation Results
Figures 2, 3 and 4 show the pressure plot for the MUSCL, WENO 33 and WENO 34 results. Note the shock present on the suction side at approximately half the chord length.
Figure 5 shows the comparison of different spatial schemes for the coefficient for pressure. The results are also compared with the referenced experimental measurements. It shows that WENO 34 scheme provide best result.
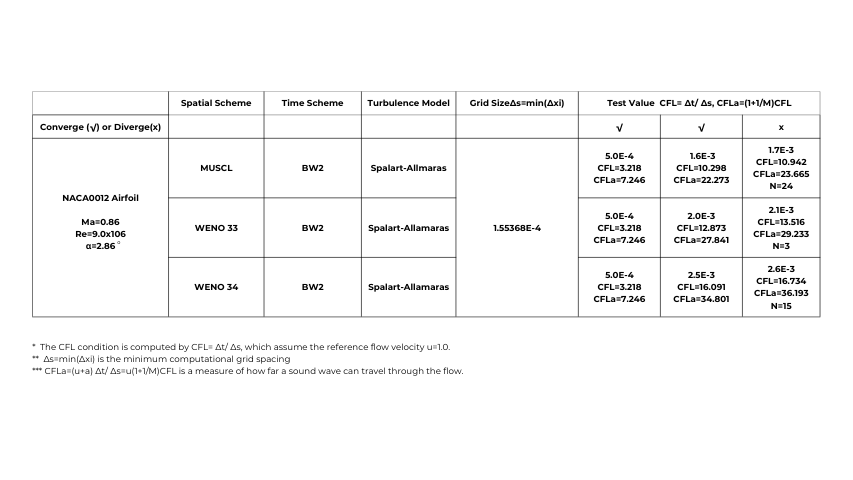
The CFL performances for different spatial schemes are also tested for this problem. The test results are summarized in Table 2.
Table 2. CFL Number Test for Different Schemes
Convergence Performance
The convergence performances of the different spatial schemes are shown in Figure 6 by comparing the iteration norm.
Figure 6. The comparison of iteration norm for different spatial schemes
Reference
Harris, C. D., “Two-dimensional Aerodynamic Characteristics of the NACA0012 Airfoil in the Langley 8-Foot Transonic Pressure Tunnel”, NACA Technical Memorandum 81927, 1981.